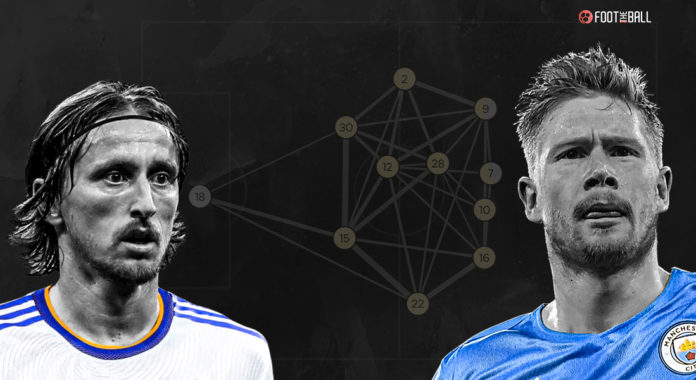
“If you can’t pass the ball properly, a bowl of pasta’s not going to make that much difference!” These are the words of former player and manager Harry Redknapp. While Redknapp’s quote is from the perspective of a frustrated manager who isn’t happy with his team, it has a deeper meaning too. In modern football, passing, or specifically good progressive passing, is a must irrespective of the position.
The game has evolved so much that top teams now demand that even a goalkeeper should be good with his feet and contribute to the team’s buildup. However, how the team passes varies according to teams, personnel, system, matches, and to some extent, even leagues. And this is where the passing network comes into play.
Data scientists, teams, and football nerds were the only metric users for the initial years of its discovery. However, now making its way into the mainstream media as well.
The metric aims to understand how teams use passes to build their play. But, of course, every team’s play varies according to their system, and the objective of the passing network is to study this play.
So, let’s have a detailed look at Pass Network.
What is a Pass Network?
Pass Network or passing network is a data visualisation tool which describes a team’s passing heat map. The metric shows us where the team makes their most passes, the players involved in those passes, and whom the player passes the most and the least.
So, what do pass networks show us?
- The line between the players shows us the pass.
- The dot’s size indicates the player’s number of passes the player attempted. The bigger the dot, the more passes he attempted.
- The thickness of the line determines the number of passes between the players. The more the number of passes attempted between two players, the thicker will be the line between them.
- Line colouring shows the impact of a player’s passing on the match. Green indicates poor performance, red shows excellent performance, yellow shows below average, and orange shows good performance.
- The brightness of the line shows us who is receiving the ball. If the line gets brighter as it approaches a player, it means the player is receiving the pass. However, if the line gets brighter as it reaches its ends, it means back-and-forth passes between two players.
- Only players who complete at least five passes per 90 minutes in a specific direction and to a particular player get the Line.
These are the basics of pass networks.
How are pass networks used in analysis?
The field is divided into different grids to make the metric more informative. This helps us determine in which part of the pitch the team is making the most passes.
These are the basics of pass networks. Now we see how we can use it to map real matches. The match between Liverpool and Manchester United at Anfield, which the former won 4-0, shows us an exciting picture.
The pass networks can quickly gauge the gulf in the performance of the two sides. On one hand, Liverpool’s pass networks show the involvement of every player, while United’s play is all over the place. On the other hand, Marcus Rashford was hardly involved in the match, while David de Gea’s limitations as a passer were exposed with Harry Maguire having to drop every time near him to receive the ball.
These passing networks have just been brought to my attention. This is embarrassing. United are all over the place, what's most worrying is that Maguire has to hold De Gea's hand back there! Genuinely woeful, tacticless. pic.twitter.com/FT4V0vT15Y
— Daniel (@ftbl_Daniel) April 20, 2022
How about a season’s entire pass network? The Athletic shared the metric for all the Premier League teams, showing some fascinating observations.
For instance, Premier League champions Manchester City’s pass networks show all players equally contribute while Liverpool’s one has fewer contributions from their forwards.
Ederson and Alisson, both brilliant passers, make their passes to the two centre-backs. However, post this, City defenders make three most passes to the midfielders, and Liverpool move the ball towards their full-backs. This confirms the fact that for Liverpool, their main attacking outlets are their full-backs- Robertson and Alexander-Arnold. While for Manchester City, the ball is moved to de Bruyne and Silva.
The two teams also played the same 4-3-3 formation, but in City’s midfield, two midfielders play in the attacking third, with the gap left by them being filled by the full-backs. In Liverpool’s system, one midfielder (usually Jordan Henderson) stayed with the defensive midfielder as the full-backs played on the field to widen the team’s play.
How does your team pass? And what does it tell you about how they play?
From #MCFC's symmetry to #MUFC's compactness to #LCFC's width, @johnspacemuller explains these maps
— The Athletic UK (@TheAthleticUK) June 7, 2022
Pass Networks can also be combined with other metrics such as the Buildup Disruption Percentage (BDP) to see how teams use passing and pressing to dominate a game.
Read More: A tour of all 8 stadiums for 2022 Qatar FIFA World Cup
Pass Networks Limitations
Like all other metrics, the pass networks also have their limitations. First is the constant change in formation, and players can hamper the final results. For instance, if a team loses two of their best passers to injuries or suspensions, which now demand a new system which places more emphasis on some other players. Analysing that match’s pass networks would lead one to believe that the team plays a different style of play than they usually do.
Second, if a line is drawn from one player to another, this doesn’t mean that all the passes were played or received in exactly the same area of the field. Third, the position that a layer has been denoted is his average position which does not always truly reflect the picture.
And lastly, just depending on the pass network data will not be helpful. This is why people try to back it up with video analysis, as the stat alone does not always represent the whole picture.
However, it does have its merits when used wisely, like Passes per Defensive Actions. (PPDA), and Field Tilt.


