Long gone are the days, when football was all about goals and assists. Well, at least when it came to stats! Fast forward to the present, and football has increasingly become more of a numbers game. Underlying stats like xT (Expected threats), BDP (Buildup disruption percentage) and xOVA (Expected Offensive Value Addition) rule the world of football at this point.
Quantifying high press has been the biggest debate in football and there are often divided opinions amongst the analysts of the metric. Different kinds of parameters have been used to measure high-defensive pressure and this is in turn viewed in relevance to pass completion percentage or pass difficulty. PPDA metric is one of the most notable and reliable measures of pressing to ever exist.
View this post on Instagram
But PPDA alone cannot help one pin down all measures of pressing. Enter ‘Field Tilt’.
What is Field Tilt?
BDP (Buildup Disruption Percentage) and PPDA (Passes Per Defensive Action) metrics are all certainly useful ways to assess pressure and how one team is disrupting opponent possession. But they are not exactly accurate if you want to pressure. It is usually tough to pin down pressure with respect to any given event. Another issue here is that there is more than one way to press an opponent and in doing so the intention might differ from player to player.
This is where ‘Field Tilt’ comes into the picture. Recently, Spurs’ performances have come under the microscope despite some good results. One reason why is because their field tilt is remarkably low for a team in their position, indicating waning dominance of the field.
From @markrstats :
Look at spurs’ field tilt… pic.twitter.com/4sclqJDjuu— YankeeGunner (@YankeeGunner) September 19, 2022
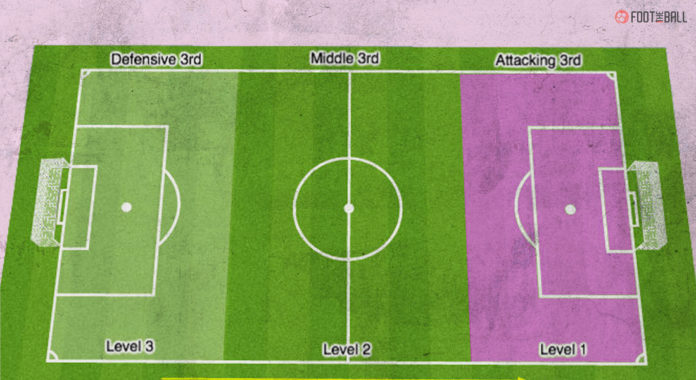
Field Tilt is basically used fo take into account a team’s share of possession in the final third in terms of touches or passes. This metric helps majorly in understanding which team has taken the attack to the opponent while having the ball, and which team has just held onto the possession.
For example, take into consideration the UCL final of 2021-22 between Chelsea and Manchester City. Chelsea made a total of 41 final-third passes, and Manchester City made 59 final-third passes, this means Manchester City had a field tilt of 59 per cent. The better attacking teams usually dominate this metric because they have more of the ball in attacking areas.
Usefulness of Field Tilt
PPDA for a team may be higher for teams who perform defensive actions higher up the pitch, leading to the conclusion that that is where most of the football takes place. The best way to divide a football pitch is into – an attacking third, midfield third and defensive third.
Napoli 0 : 1 Milan
▪ xG: 0.43 – 1.11
▪ xThreat: 1.42 – 1.02
▪ Possession: 59.8% – 40.2%
▪ Field Tilt: 58.2% – 41.8%
▪ Def Line Height: 41.3 – 43.6 pic.twitter.com/f6GaQiYmly— markstats bot (@markstatsbot) March 6, 2022
Positioning in modern football is often judged by the players passing percentage accuracy, which is;t the most efficient way of measuring it. A defender might have higher accuracy than a forward when it comes to passes – albeit the defender being under less pressure
Burnley 0 : 4 Chelsea
▪ xG: 0.78 – 2.19
▪ xThreat: 1.04 – 1.52
▪ Possession: 27.9% – 72.1%
▪ Field Tilt: 34.2% – 65.8%
▪ Def Line Height: 48.5 – 42.6 pic.twitter.com/xTzBjfivSj— markstats bot (@markstatsbot) March 5, 2022
The same goes for recoveries. Some soccer people often suggest that a match is won and lost in the midfield third. That being said, field tilt metrics do not give an analyst the complete data it needs and is no indication of the ball reaching advanced positions of the football pitch.
No advanced statistic can be looked at in isolation.With Field Tilt coming into the frame though after combining it with BDP and PPDA, a very good output can be presented and give an indication of where that particular game is headed.


